![]()
First of April - Now what?
From the 1st of April - independently whether you refer to EU nationals as expats or immigrants - both will need to apply for settled status, via an Android app. An iPhone app is not in the planning. Apple was reported to have decided against enabling its technology to read the chip on modern passports. With nearly half users in the UK estimated to use an iPhone, the extra work will drop on the heads of Home Office caseworkers.
EU nationals with sufficient evidence for UK residence - a bank account, an address, a national insurance number, a passport, a work history, an android phone, no confusion with previous permits and no fear to deal with the authorities - are are anticipated to sail through the process without trouble.
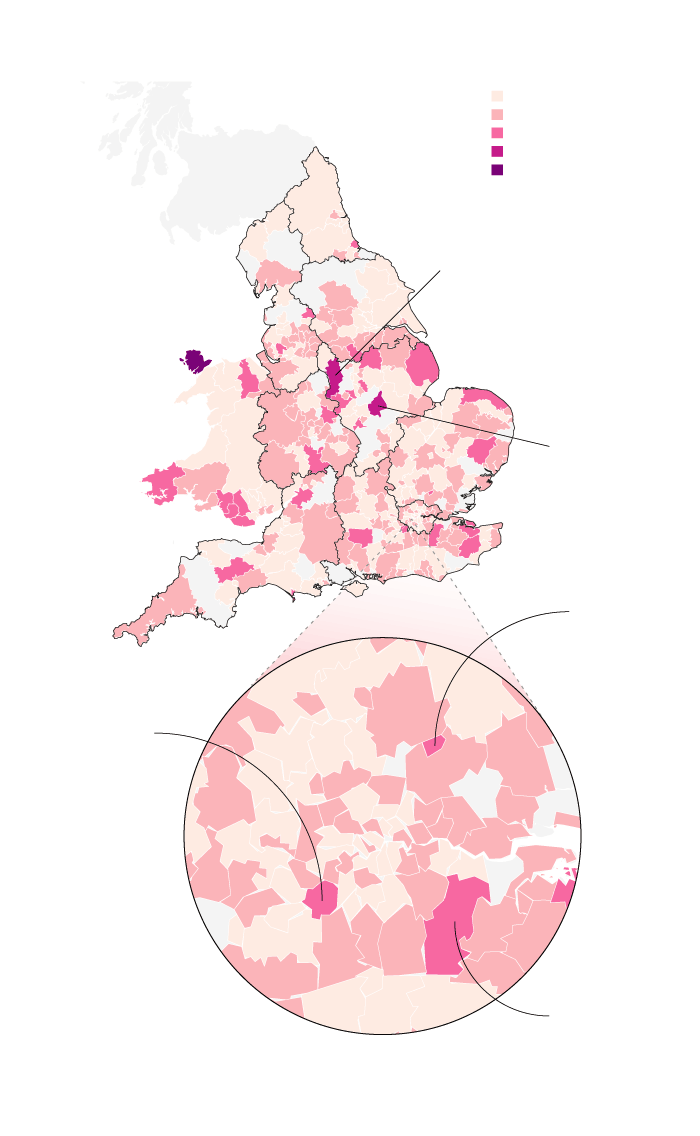
On the contrary, EU migrants experiencing language problems – estimated at a quarter of a million non-Irish EU adults who struggle with English – might hit a wall. The government pledged to translate the EU Settlement Scheme overview document into 23 EU languages. Yet, despite the goodwill it is unclear if the application itself will offer other languages. Mr. Antoni says there is no sign of it.
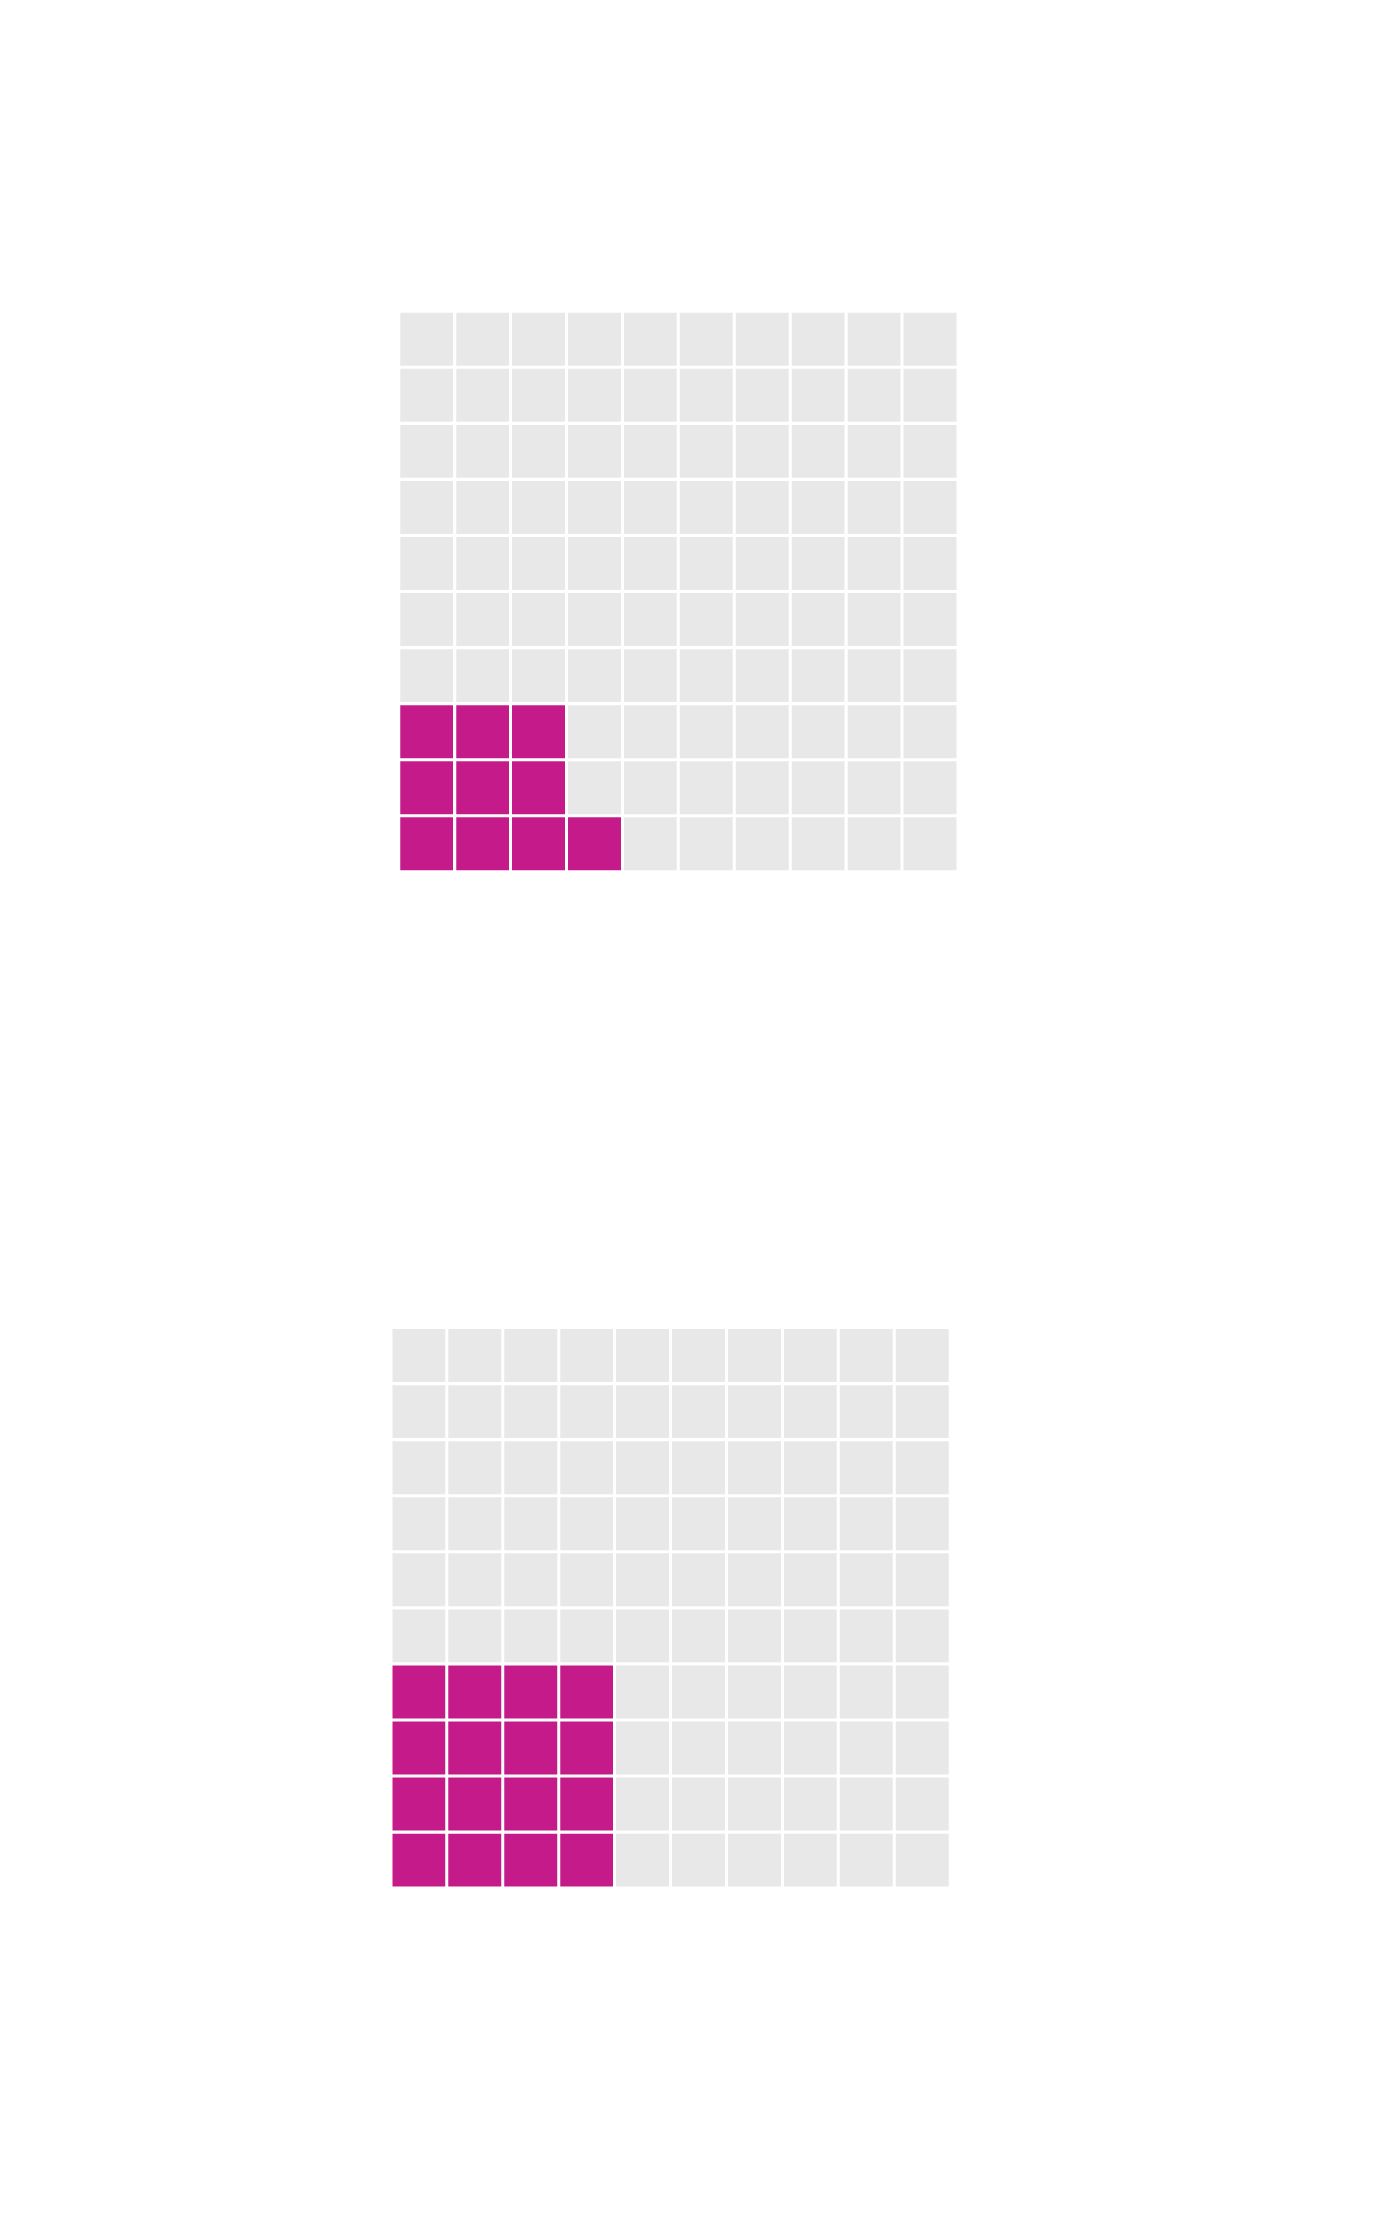
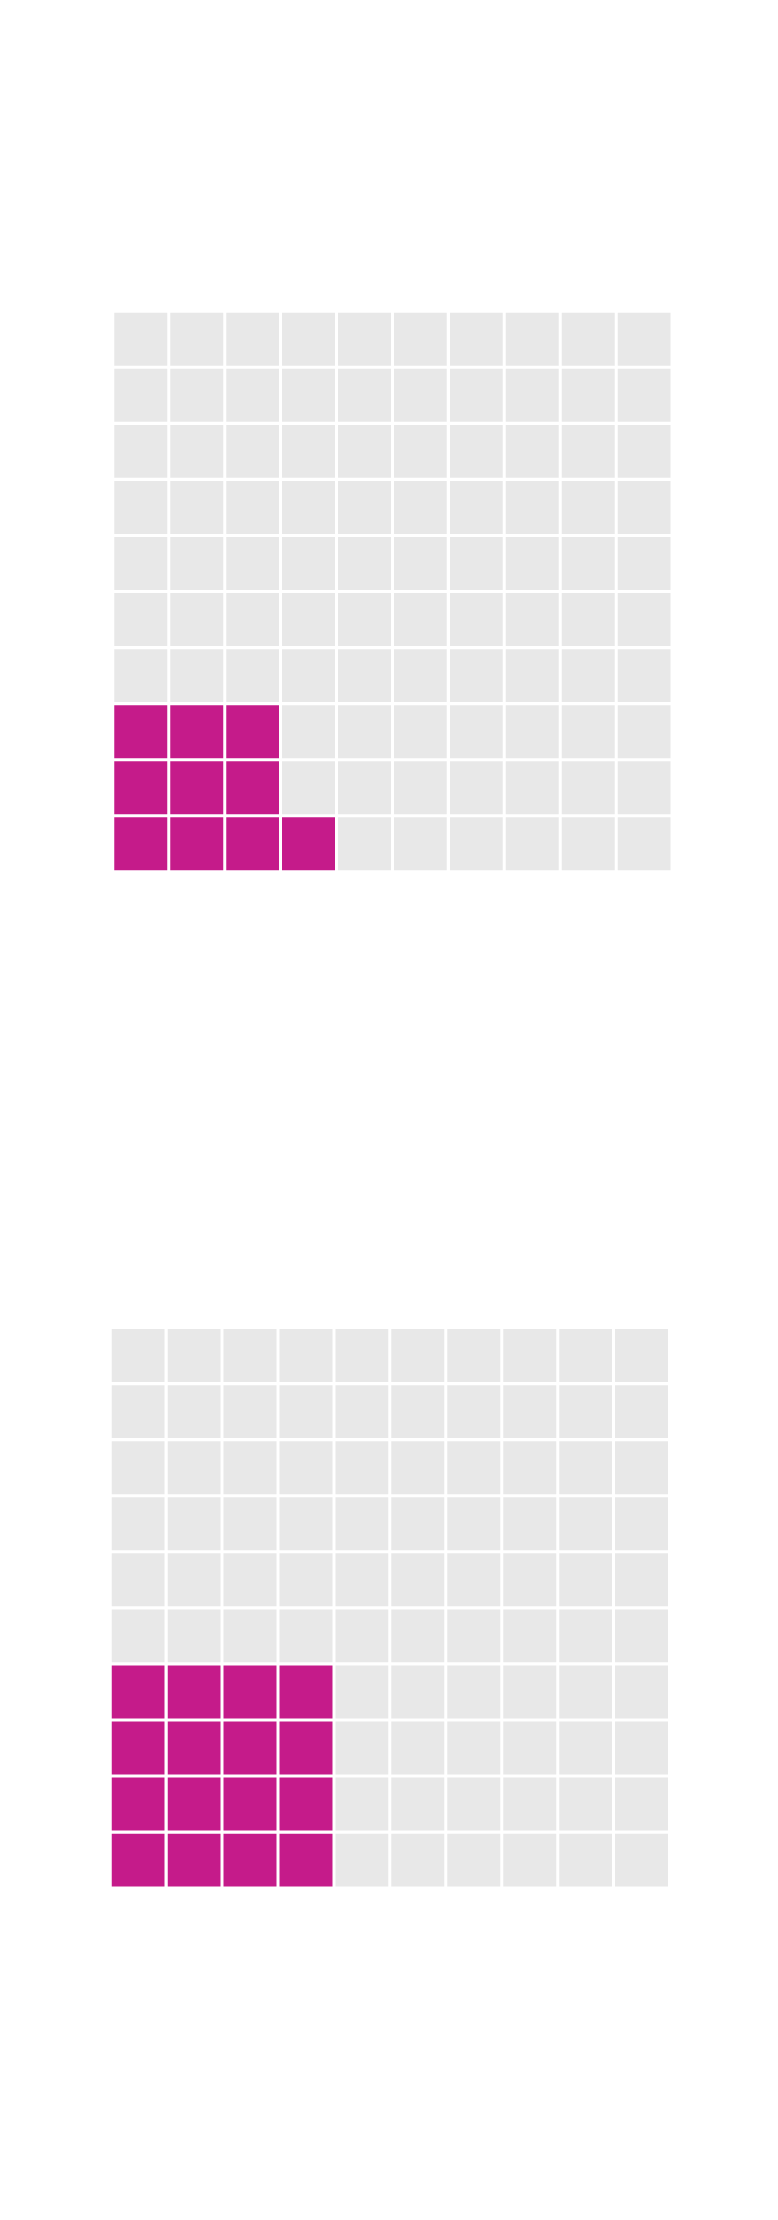
Earlier studies have shown that around 19% (first trial) experienced difficulties with some of the terminology in the application. 9% agonized over inputting their names, sometimes due to different naming conventions. Language proficiency, better mental health, good education and deft with technology is unlikely to fail young Londoners.
Young Londoner especially, might have also the advantage of a larger social network. It could be easier to share Android phones if there are many to call on if one has only iPhone to offer. To borrow their friend's device for applying was mentioned as a suggestion by the administration. How feasible this advice really is, remains uncertain. Meanwhile, media coverage gravitates towards younger, educated and outspoken EU nationals in London. Few appearances are made by individuals from vulnerable groups such as the elderly, children, or EU citizens living in isolation.

Evening Standard story: 'The EU 27 speak: adopted Londoners tell how Brexit has already changed their lives' – Millennials in the focus. So far, vulnerable EU groups in rural or poorer areas received little attention by the media how Brexit affect their lives.